Layers: what they are for, how to use them.
Note, over time, new features are introduced into our software regularly and some screen layouts change.
Everything discussed below is still valid, although some screen layouts will now vary.
Layers are Motifs that haven’t been permanently pasted into a chart.
The reason for having layers is to allow you to move elements of a design around without erasing what lies beneath, until you are happy with the layout.
For example, you might add lettering to a design, but decide to move it closer to the centre, or align it left or right.
In this design, I want to add the word ‘Bee’ 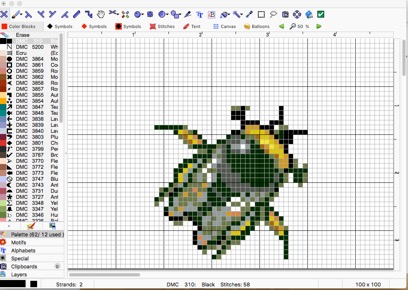
Using normal lettering, if I add ‘Bee’ as a motif and paste it in the wrong place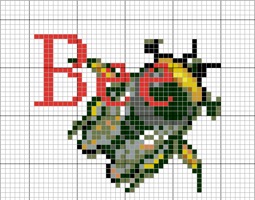
..then I could use UNDO to take the letters off again.
But if I have done other work afterwards, there is no way to move the letters while still keeping the bee intact.
The red stitches of the letters have completely replaced the black and yellow of the bee.
If I paste the word Bee as a new LAYER, it looks exactly the same to your eye.
But the layer shows up in the layers list on the left of the screen, like this: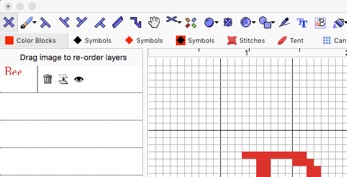
(To paste as a LAYER instead of ordinary paste, use CMD-L on the Mac or CTRL-L on the PC)
Now, if you click on that row, the word ‘Bee’ will be shown as selected by a green rectangle: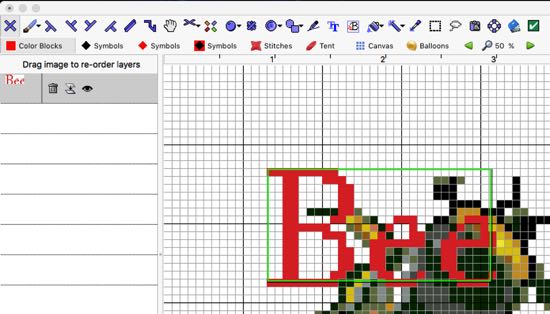
And you can now drag the word Bee to another place without damaging the picture underneath.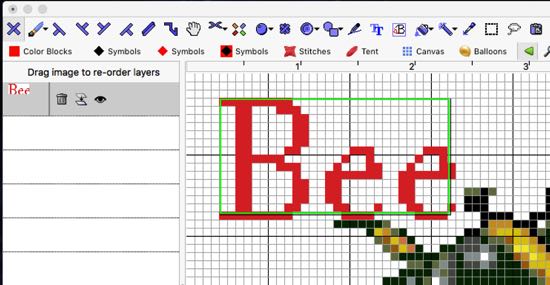
So if I added more layers (Paste using CMD-L instead of using CMD_V, or using ‘Paste as new layer’ from the menus)
Then more layers would appear in the list, like so: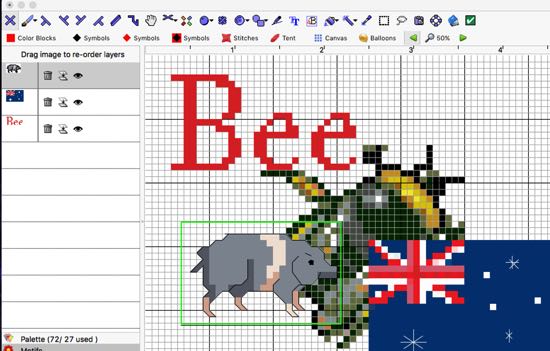
Each of these layers can be dragged around without erasing the background: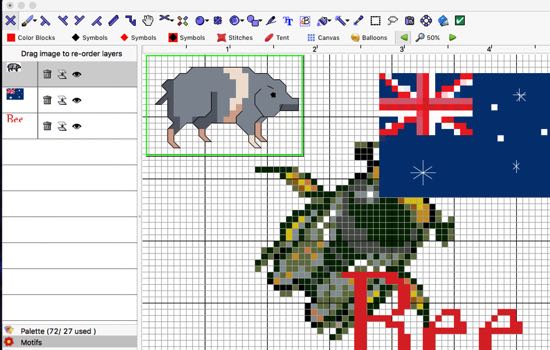
Priority
Layers don’t interfere with each other: they are independent and drawn in the reverse order they appear in the list.
The ones at the top are drawn last, and if they live in the same place on the design, the ones at the top are the ones you see.
Here, the pig is on top of the flag: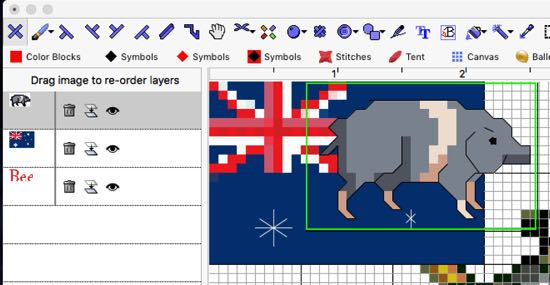
But by dragging the pig down the list to a place under the flag we can reverse that drawing sequence.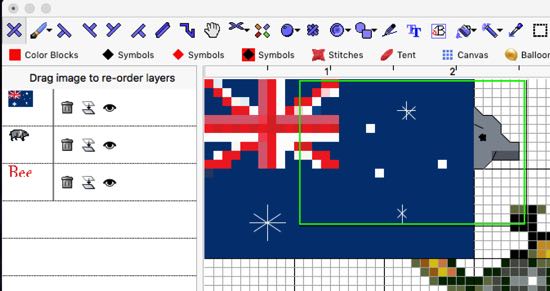
Show/Hide
You can temporarily hide a layer if you like.
Use the ‘eye’ icon in the layers list to make a layer visible or not.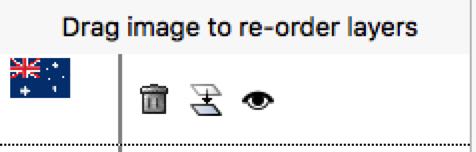
Click the eye and the layer will vanish. The icon will show as an eye with a cross through it.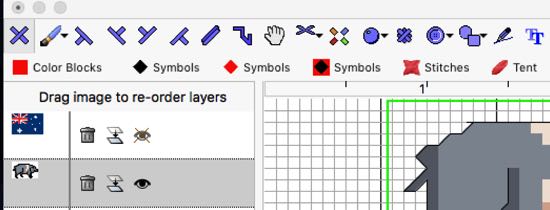
Flatten
If you are sure you will not need to move a layer again, you can merge it with the main design permanently, using the ‘merge’ icon next to the eye.
Once this is done, stitches under the layer will be replaced by stitches of the layer and it will no longer appear in this list.
Delete
If you are sure you will not need a layer again, you can delete it by clicking on the trashcan icon.
Images as a Layer.
You can INSERT a picture as a layer.. useful for adding a logo or perhaps a small explanatory image.
Use the Insert menu/ Insert an Image.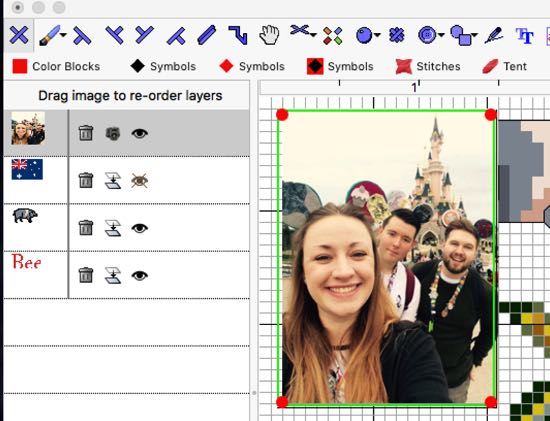
Unlike a layer of stitches, an image has 4 grab handles at the corners.
Using these red grab handles, you can resize the image as well as being able to move it.
Image as an Onion Skin
You may choose to put the image BEHIND the grid.
This will allow you to draw freehand over the top to recreate an image in stitching, rather than importing it and having the program convert it to stitches in the process.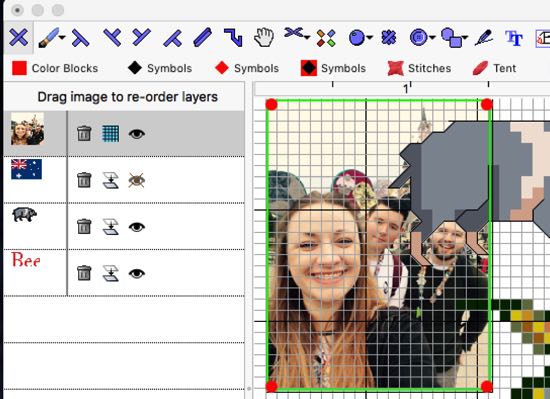
Here you can see the grid and the pig are both in front of the image, even though it is top of the layers list.
Layers are saved with your chart, but charts which include layers are no longer recognisable by versions of our software from before 2016, as we used a new file format to hold this variable data.
Visible Layers are printed with your chart, or exported to PDF, as if they had been merged.
e.g. If you have a blue area and a red motif covers it, the stitch count of the blue will be reduced by the area covered with red.