How to use Onion Skin mode to recreate a chart.
Note, over time, new features are introduced into our software regularly and some screen layouts change.
Everything discussed below is still valid, although some screen layouts will now vary.
This section was prompted by the following question:
How can I scan a chart and turn it into an editable design?
Many scanners ship with software called ‘OCR’ software, which can ‘read’ a printed page and turn the image back into words that can be edited in your work processor. Sadly, no such software exists to recognise and recover the various symbols that form a cross stitch chart, or turn the colours of a stitched piece into a simple small list of shades.
So we need to do something a little more manual.
Note: we are aware that one of the uses of this technique is to copy existing charts.
If you do not own the copyright to the printed work, it is illegal to recreate the design and sell it yourself.
How to recreate a printed or stitched work.
First, scan your design, and save the result as a PNG or JPG image.
The scan resolution is not very important: the onion skin technique doesn’t need massive detail.
It is vital that the image is not ’skewed’ (rotated away from the vertical).. the lines must be straight up and down, or left to right.
Next, crop the image so that you only have full squares.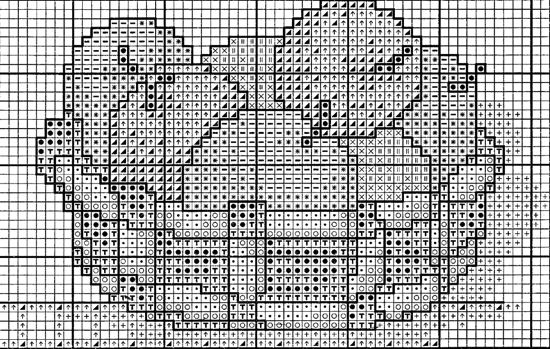
Now count the squares.
This design has 60 x 38 stitches.
Create a new blank chart of the same size in squares as the image will be.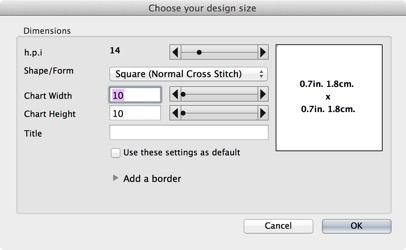
Then, go to the View menu, and choose Onion Skin/Add
Click ‘Select Image’ and choose the scanned image and click OK
Tick the ‘Stretch to fit’ box.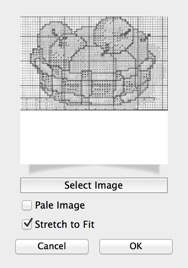
The program will now show the chart behind the grid, like this: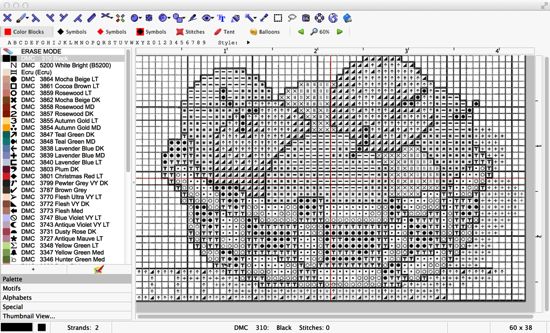
At this point, we can see symbols ‘through’ the grid.
If your scan isn’t quite aligned, you can adjust it by zooming in/out, stretching, or rotating slightly, until the grid lines line up.
Use the View menu/ Onion Skin/adjust option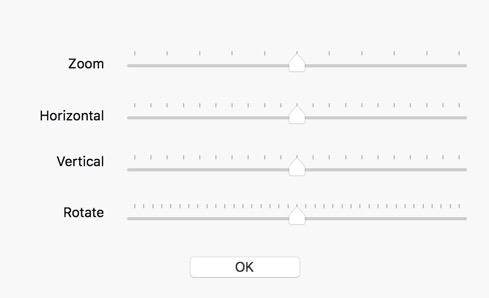
The next stage is to color them in. This is rather like stitching from the chart, but we are painting on the screen.
Assuming some apples are shades of green, identify the symbols, and decide what colors you are going to use.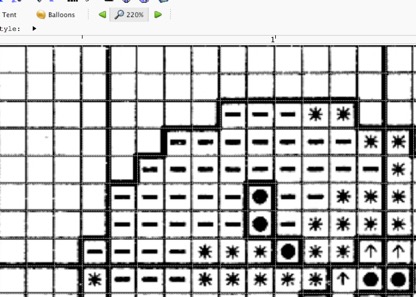
Im going to use dark green for the stars, and light green for the dashes.
The circles will be brown for stalks.
Pick a dark green color, and draw in full stitches over the stars.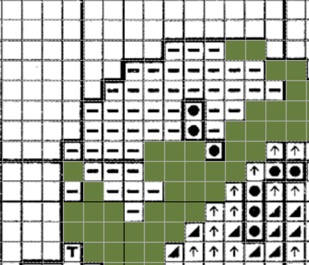
Repeat for the light green, and the brown.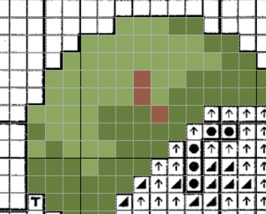
When you have covered all the stitches, go to the View menu, and Cancel the Onion Skin image.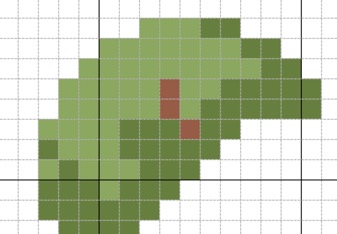
Now, you can add backstitch if you like.
Switching to symbol mode gives you a printable chart..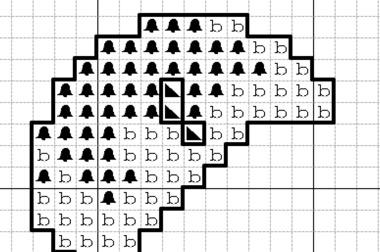
The randomly assigned symbols don’t match the originals here, but you could change the symbols associated with each colour at this stage if you like.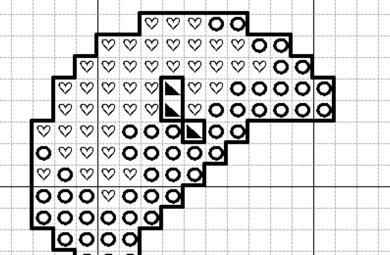
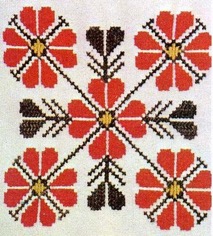
And of course, with a little more work , the same technique can be used to recreate a picture of actual stitching.
The biggest challenges there are that real stitching isn’t as neat as a printed chart (squares may not be perfect squares: compare the bottom left flower with the top right!).
And its also difficult to count the number of stitches.